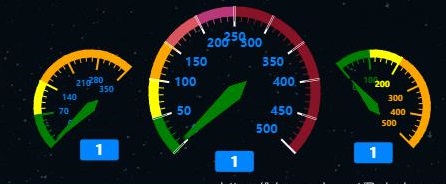
| 导读 | 这篇文章主要为大家详细介绍了vue实现echarts中的仪表盘,文中示例代码介绍的非常详细,具有一定的参考价值,感兴趣的小伙伴们可以参考一下 |
本文实例为大家分享了vue实现echarts中的仪表盘的具体代码,供大家参考,具体内容如下
最终结果

一、安装
1. 首先需要安装echarts依赖包
npm install echarts -S
2. 或者使用国内的淘宝镜像:
npm install -g cnpm --registry=//registry.npm.taobao.org
二、创建图表
全局引入
main.js
// 引入echarts
import echarts from 'echarts'

Vue.prototype.$echarts = echarts
Hello.vue
export default {
    data(){
      return {}
    },
     mounted(){
        this.myChart() //函数调用
     },
     methods:{
        myChart() {
        let columnar = this.$echarts.init(document.getElementById('myChart'));
        columnar.setOption({
          tooltip : {
            formatter: "{a}
{c} {b}"
          },
          toolbox: {
            show: true,
            feature: {
              restore: {show: true},
              saveAsImage: {show: true}
            }
          },
          series : [
           {
                    name: '空气质量:',
                    type: 'gauge',
                    z: 3,
                    min: 0,
                    max: 500,
                    splitNumber: 10,
                    radius: '60%',
                    axisLine: {
                        lineStyle: {
                            width: 10,
                            color: [[0.1, 'green'], [0.2, 'yellow'],[0.3, 'orange'],[0.4,'#db555e'],[0.5,'#ba3779'],[1.1,'#881326'] ]
                        }
                    },
                    axisTick: {
                        length: 15,
                        lineStyle: {
                            color: 'auto'
                        }
                    },
                    //刻度分割线样式
                    splitLine: {
                        length: 20,
                        lineStyle: {
                            color: 'white'
                        }
                    },
                    //刻度数字样式
                    axisLabel: {
                        fontWeight:'bold',
                        color: '#0085FF',
                    },
                    detail : {
                        //说明数字大小
                        formatter: function (value) {
                            return value;
                        },
                        offsetCenter:['0%','80%'],
                        fontWeight: 'bolder',
                        borderRadius: 3,
                        backgroundColor: '#0085FF',
                        fontSize:14,
                        width: 100,
                        color: 'white',
                        padding:[5,15,2,15]
                    },
                data:[1,2,3,4,5,6,7]
                },
            {
                    name: 'PM2.5:',
                    type: 'gauge',
                    center: ['20%', '55%'],
                    radius: '40%',
                    min:0,
                    max:350,
                    valu:55,
                    endAngle:45,
                    splitNumber:5,
                    axisLine: {
                        lineStyle: {
                            width: 8,
                            color: [[0.2, 'green'], [0.4, 'yellow'],[1.1,'orange'] ]
                        }
                    },


                    axisTick: {
                        length:12,
                        lineStyle: {
                            color: 'auto'
                        }
                    },
                    splitLine: {
                        length:20,
                        lineStyle: {
                            color: 'auto'
                        }
                    },
                    pointer: {
                        width:5,
                        color:'red'
                    },
                //刻度数字样式
                    axisLabel: {
                        fontWeight:'bold',
                        color: '#0085FF',
                        fontSize:8,   //改变仪表盘内刻度数字的大小

                    },
                    detail: {
                        formatter: function (value) {
                            return value;
                        },
                        offsetCenter:['15%','75%'],
                        fontWeight: 'bolder',
                        borderRadius: 3,
                        backgroundColor: '#0085FF',
                        fontSize:14,
                        width: 100,
                        color: 'white',
                        padding:[5,15,2,15]
                    },
                    data:[1,2,3,4,5,6]
                },
           {
                    name: 'PM10:',
                    type: 'gauge',
                    //仪表盘位置
                    center: ['79%', '55%'],
                    //仪表盘半径
                    radius: '40%',
                    min:0,
                    max:500,
                    startAngle:130,
                    splitNumber:5,
                    //仪表盘弧线宽度
                    axisLine: {
                        lineStyle: {
                            width: 8,
                            color: [[0.2, 'green'], [0.4, 'yellow'],[1, 'orange'] ]
                        }

                    },
                    //仪表盘小刻度样式
                    axisTick: {
                        length:12,
                        lineStyle: {
                            color: 'auto'
                        }
                    },
                    //仪表盘大刻度样式
                    splitLine: {
                        length:20,
                        lineStyle: {
                            color: 'auto'
                        }
                    },
                    //仪表盘指针样式
                    pointer: {
                        width:5,//指针的宽度
                        length:"60%", //指针长度,按照半圆半径的百分比
                        shadowColor : 'blue', //默认透明
                        shadowBlur: 5
                    },

                    //刻度数字样式
                    axisLabel: {
                        fontWeight:'bold',
                        color: 'auto',
                        fontSize:8,   //改变仪表盘内刻度数字的大小

                    },
                    detail: {
                        //说明数字大小
                        formatter: function (value) {
                            return value;
                        },
                        //仪表盘下方文字说明
                        offsetCenter:['0%','80%'],
                        fontWeight: 'bolder',
                        borderRadius: 3,
                        backgroundColor: '#0085FF',
                        fontSize:14,
                        width: 100,
                        color: 'white',
                        padding:[5,15,2,15]
                    },
                data:[1,2,3,4]
                }
          ]
        })
      }
  }
以上就是本文的全部内容,希望对大家的学习有所帮助。
原文来自:
本文地址://gulass.cn/vue-echarts-linux.html编辑:倪家兴,审核员:逄增宝
Linux大全:
Linux系统大全:


